
My latest posts can be found here: Previous blog posts:
Additionally, some earlier writings: |
Recently I found something I wrote a while ago, and with one or
two touches I thought it was worth recycling. So I refreshed it
a little and integrated it into my blog. As is my wont I then
mentioned it in a couple of places, and went back to work.
Imagine my surprise when on Hacker News (often known simply as "HN") the item suddenly got a lot of attention. Indeed, I was very surprised, and I set up some tracking to see what happened ... this is the report. It's worth noting that Hacker News can result in a "hug of death" and a site going down from the traffic. That's not very likely in my case as the page is plain HTML, and in fact, very, very elderly HTML that desperately needs bringing up to date. But ignoring that, I was expecting some traffic. But the amount of traffic depends on a few things. Firstly, the currently ranking of the item on the Front Page. When an item falls off the Front Page of HN the traffic plummets, that's only to be expected. But there might be some relationship between where the item is on the Front Page and the number of click-throughs. Probably the data I collected probably isn't up to that, but it might be interesting to see if we can see that. Secondly, HN is sometimes very busy, and sometimes not so busy. We can't measure that, but we do have a proxy. We can look at the age of the last item on the "Newest" page. If that's very young, then items are being submitted quickly, and we can assume the site is busy. If the $20^{th}$ item is over an hour old, we can assume the site is not very busy. So let's start by looking at the age of the $20^{th}$ oldest item on the "Newest" page:
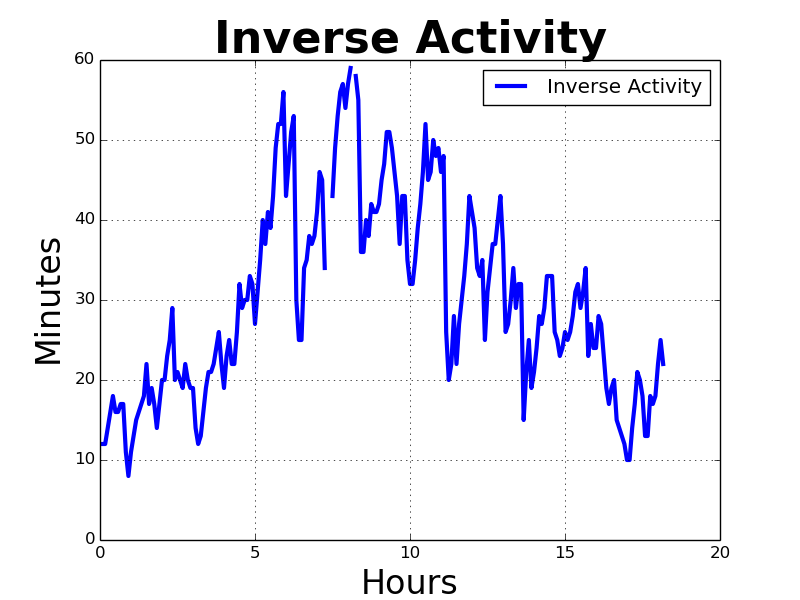 We can see that over the 15 hours or so that the item was on the Front Page HN was very busy, then not so busy, then getting busy again. This is measured in "Minutes Age of the $20^{th}$ Item", and we can invert that to get "Items submitted per Hour":
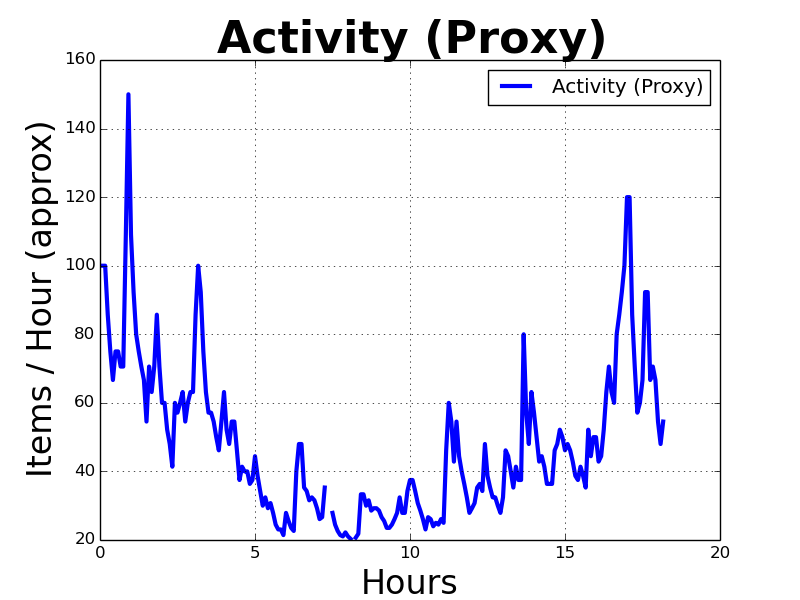 This is, as the title says, a proxy for the level of activity. Next we can look at where the item ranks on the Front Page:
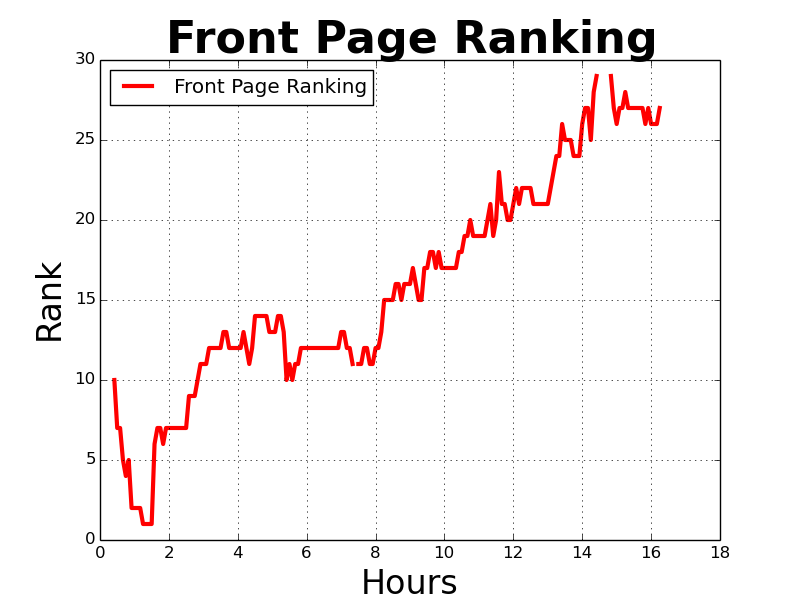 This is a little misleading, as the rising line corresponds to the falling item. To that end, instead of the rank we can plot "30 minus the rank":
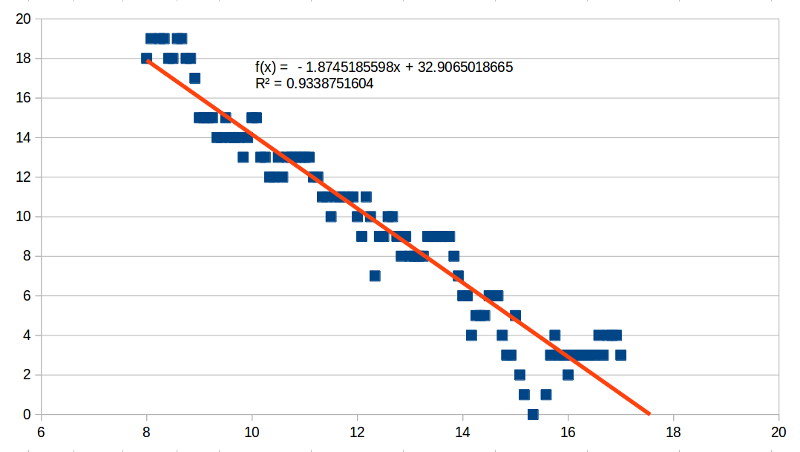
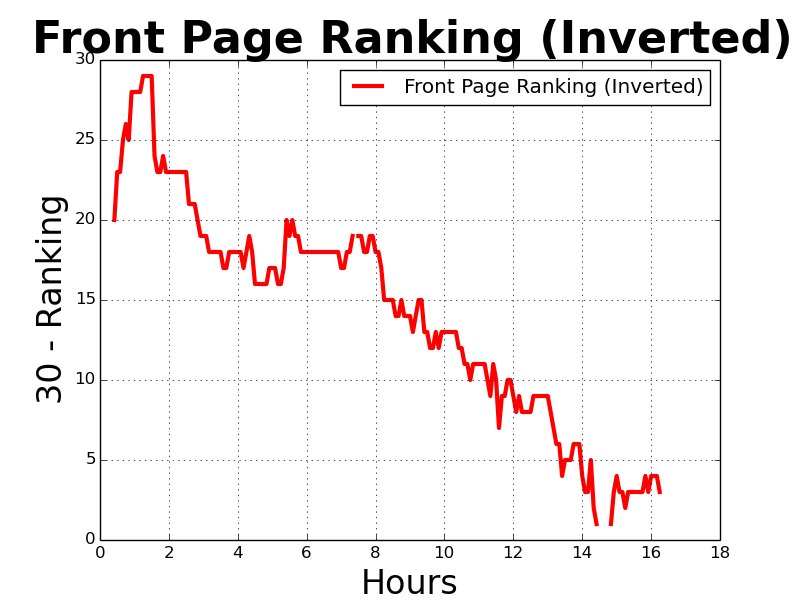 Interesting feature to note is that after 8 hours on the Front Page the fall in ranking is almost linear:
 So what kind of traffic did this generate? Looking at the logs we have the following:
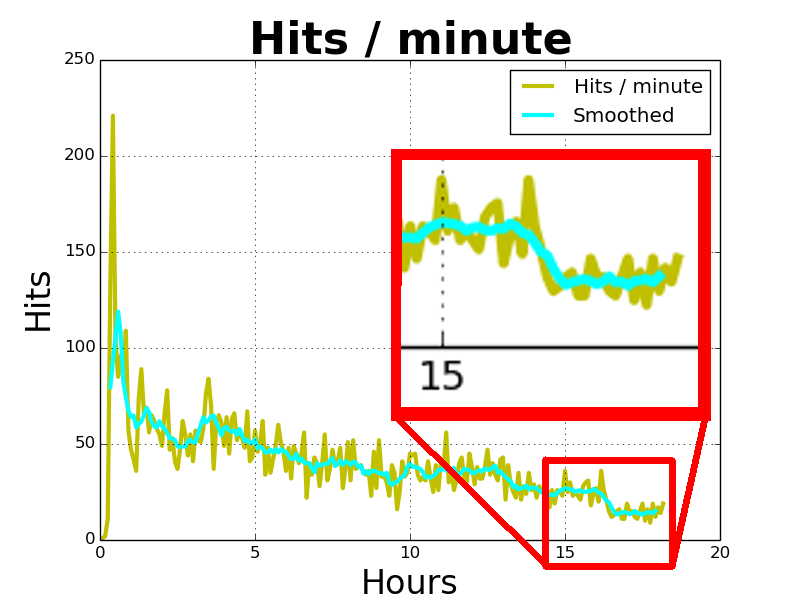
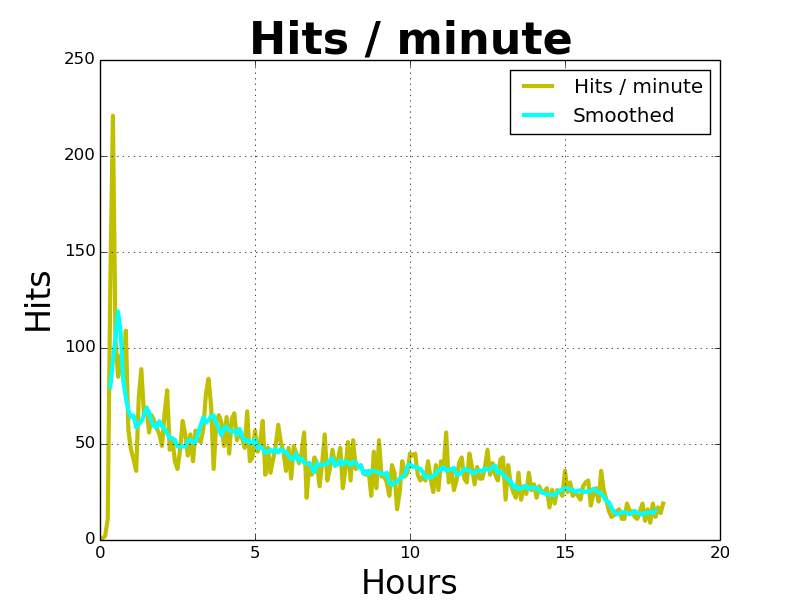 We can see the huge initial spike, and the tail off at the end, but through the range of 5 to 13 hours (or so) there is a constant stream of 40 to 50 hits per minute. That's consistent with the final (so far!) tally or about 48k to 49k hits registered in the logs. Interestingly, the images in the page were only loaded about half the time, so clearly there are people browsing with "images off", which is perhaps worth knowing, but not surprising. Also unsurprising is the drop off when the item falls from the Front Page. That happens just after 16 hours, and you can clearly see the drop in visits:
 It might be an interesting exercise to plot Hits against Rank, and try to draw out the effect of "Activity", remembering that as time goes by, many of the visitors to the Front Page could be returning, and hence already seen the submission. If we assume that there's an underlying hit rate and subtract that from the hits, then plot the hits against the rank, perhaps there's something to be seen. Not at all sure the existing data would warrant any conclusion on that question, especially with the confounding factor of activity. However, as a quick hack we can plot the different quantities on the same chart, and scale everything to get things to match. We can also adjust the traces up and/or down, and see if we can get things to line up, and then see if we can explain them. So here we have the plots, arbitrarily scaled and vertically shifted:
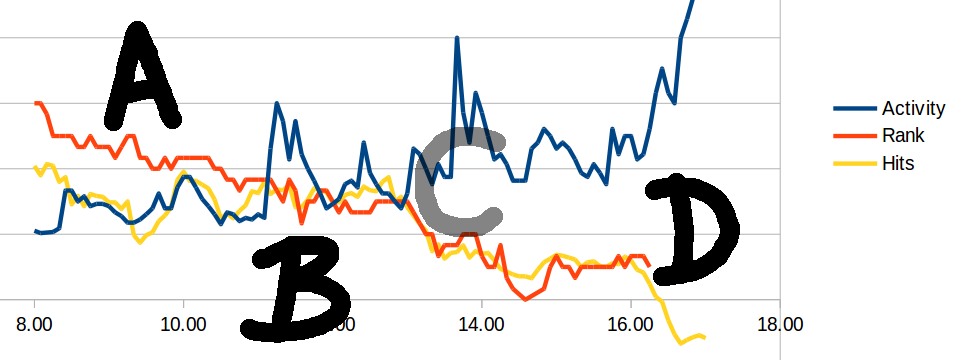 In area A we can see that the number of hits is following the (proxy for the) Activity on the site, so perhaps it's simply the number of visitors driving the hits, and we're getting some fixed percentage of visitors clicking through. Then in area B as the activity starts to pick up, the hits are following the ranking, with a lower ranking producing fewer hits, etc. That's perhaps understandable as well. That continues through to area C where the uptick in activity is producing more items submitted, and so more items that can be ranked above this one. As a consequence the ranking falls, and the number of hits follows. Finally, in area D, the item falls off the Front Page (probably because it incurred the "Time Penalty") and the number of hits falls off a cliff. So there you are. If you have any questions (other than "Why did you bother?") then feel free to ping me via the comment form, or by direct email if you have a working address for me. If you do contact me via the form and want an answer, don't forget to provide a working return email address for youself!
Send us a comment ...
|

 Suggest a change ( <--
What does this mean?) /
Send me email